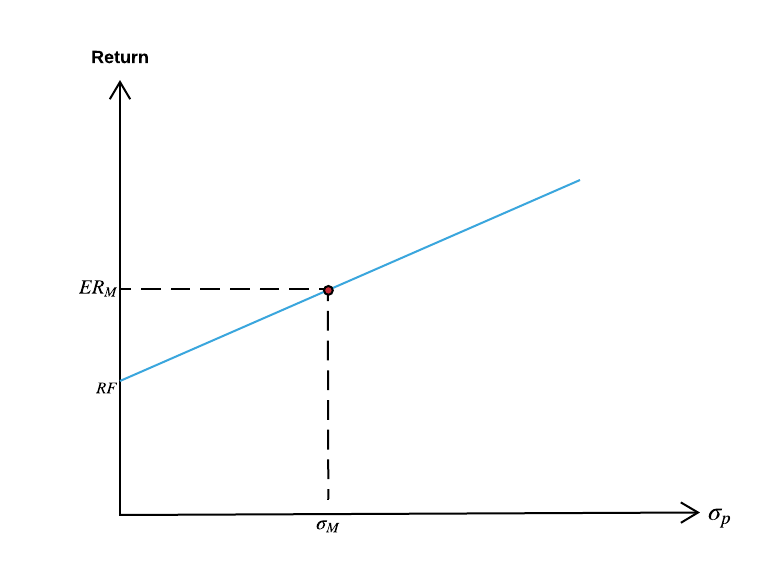
The capital market line (CML) represents portfolios that optimally combine risk and return. It is a theoretical concept that represents all the portfolios that optimally combine the risk-free rate of return and the market portfolio of risky assets.
What is CML / Capital Market Line?
The Capital Market Line is a graphical representation of all the portfolios that optimally combine risk and return. CML is a theoretical concept that gives optimal combinations of a risk-free asset and the market portfolio. The CML is superior to Efficient Frontier because it combines risky assets with risk-free assets.
Key Notes:
- The capital market line (CML) represents portfolios that optimally combine risk and return.
- CML is a special case of the capital allocation line (CAL) where the risk portfolio is the market portfolio. Thus, the slope of the CML is the Sharpe ratio of the market portfolio.
- If we draw a line from the risk-free rate of return, which is tangential to the efficient frontier, we get the Capital Market Line. The point of tangency is the most efficient portfolio. ·
- Moving up the CML will increase the portfolio’s risk, and moving down will decrease the risk. Subsequently, the return expectation will also increase or decrease, respectively.
Related: Investment vs Speculation | 7 key Difference
Understanding Capital Market Line (CML)

Sharpe Ratio:

What the CML Can Tell You?
Portfolios that fall on the capital market line (CML), in theory, optimize the risk/return relationship, thereby maximizing performance.
The capital allocation line (CAL) makes up the allotment of risk-free assets and risky portfolios for an investor.
CML is a special case of the CAL where the risk portfolio is the market portfolio. Thus, the slope of the CML is the Sharpe ratio of the market portfolio.
As a generalization, buy assets if the Sharpe ratio is above the CML and sell if the Sharpe ratio is below the CML.
CML differs from the more popular efficient frontier in that it includes risk-free investments. The intercept point of CML and efficient frontier would result in the most efficient portfolio, called the tangency portfolio.
The CAPM is the line that connects the risk-free rate of return with the tangency point on the efficient frontier of optimal portfolios that offer the highest expected return for a defined level of risk, or the lowest risk for a given level of expected return.
As an investor moves up the CML, the overall portfolio risk and returns increase. Risk-averse investors will select portfolios close to the risk-free asset, preferring low variance to higher returns.
Less risk-averse investors will prefer portfolios higher up on the CML, with a higher expected return, but more variance.
By borrowing funds at a risk-free rate, they can also invest more than 100% of their investable funds in the risky market portfolio, increasing both the expected return and the risk beyond that offered by the market portfolio.
Capital Market Line vs. Security Market Line
The CML is sometimes confused with the security market line (SML). The SML is derived from the CML.
While the CML shows the rates of return for a specific portfolio, the SML represents the market’s risk and return at a given time, and shows the expected returns of individual assets.
And while the measure of risk in the CML is the standard deviation of returns (total risk), the risk measure in the SML is systematic risk or beta.
Securities that are fairly priced will plot on the CML and the SML.
Securities that plot above the CML or the SML are generating returns that are too high for the given risk and are underpriced.
Securities that plot below CML or the SML are generating returns that are too low for the given risk and are overpriced.
Why Is the Capital Market Line Important?
Portfolios that fall on the capital market line (CML), in theory, optimize the risk/return relationship, thereby maximizing performance.
So, the slope of the CML is the Sharpe ratio of the market portfolio. As a generalization, investors should look to buy assets if the Sharpe ratio is above the CML and sell if the Sharpe ratio is below the CML.
How Is Capital Allocation Line (CAL) Related to CML?
The capital allocation line (CAL) makes up the allotment of risk-free assets and risky portfolios for an investor.
CML is a special case of the CAL where the risk portfolio is the market portfolio. As an investor moves up the CML, the overall portfolio risk and returns increase.
Risk-averse investors will select portfolios close to the risk-free asset, preferring low variance to higher returns. Less risk-averse investors will prefer portfolios higher up on the CML, with a higher expected return, but more variance.
Conclusion
The Capital Market Line (CML) draws its basis from the capital market theory and the capital asset pricing model.
It is a theoretical representation of different combinations of a risk-free asset and a market portfolio for a given Sharpe Ratio.
It is superior to the efficient frontier because it only consists of risky assets/market portfolios.
The CML combines this market portfolio with this market portfolio. As we move up along the capital market line, the risk in the portfolio increases, and so does the expected return.
If we move down along the CML, the risk decreases, as does the expected return. We can use the CML formula to find the expected return for any portfolio given its standard deviation.

1 comment on “What is CML / Capital Market Line?”